# Lesson 3 | NLG
In this lesson, we'll use Compose SDK to show natural language insights from a query. We won't be building on the code from the previous lessons, so feel free to create a new file for this lesson.
# Generate data model
To define a query using Compose SDK, we’ll first need to generate a TypeScript representation of the data model. We'll do this using the Compose SDK CLI tool for the Sample Retail model.
To generate the data model:
- Create a folder in the
srcdirectory of you project namedmodels - Run the following command
npx @sisense/sdk-cli@latest get-data-model --token <api-token> --output src/models/sample-retail.ts --dataSource "Sample Retail" --url <your-instance-url>
Be sure to replace the placeholders with your API token and the URL of your Sisense instance.
# Add a chart
We'll assume you already know about how charts work, but if you don't, check out Lesson 1 from the Charts Tutorial for more information on anything that's confusing here.
We'll use the empty App component again as an example, but feel free to give your component a different name.
Go ahead and add the following to render a chart.
import { Chart } from "@sisense/sdk-ui";
import { measureFactory } from "@sisense/sdk-data";
import * as DM from "./models/sample-retail";

function App() {
  const dimensions = [DM.DimProducts.CategoryName];
  const measures = [
    measureFactory.sum(DM.Fact_Sale_orders.OrderRevenue),
    measureFactory.sum(DM.Fact_Sale_orders.OrderQty),
  ];

  return (
    <div
      style={{
        display: "flex",
        flexDirection: "column",
        rowGap: 20,
        width: 1000,
      }}
    >
      <Chart
        dataSet={DM.DataSource}
        chartType={"column"}
        dataOptions={{
          category: dimensions,
          value: [
            measures[0],
            {
              column: measures[1],
              showOnRightAxis: true,
            },
          ],
        }}
        styleOptions={{
          height: 400,
        }}
      />
    </div>
  );
}

export default App;
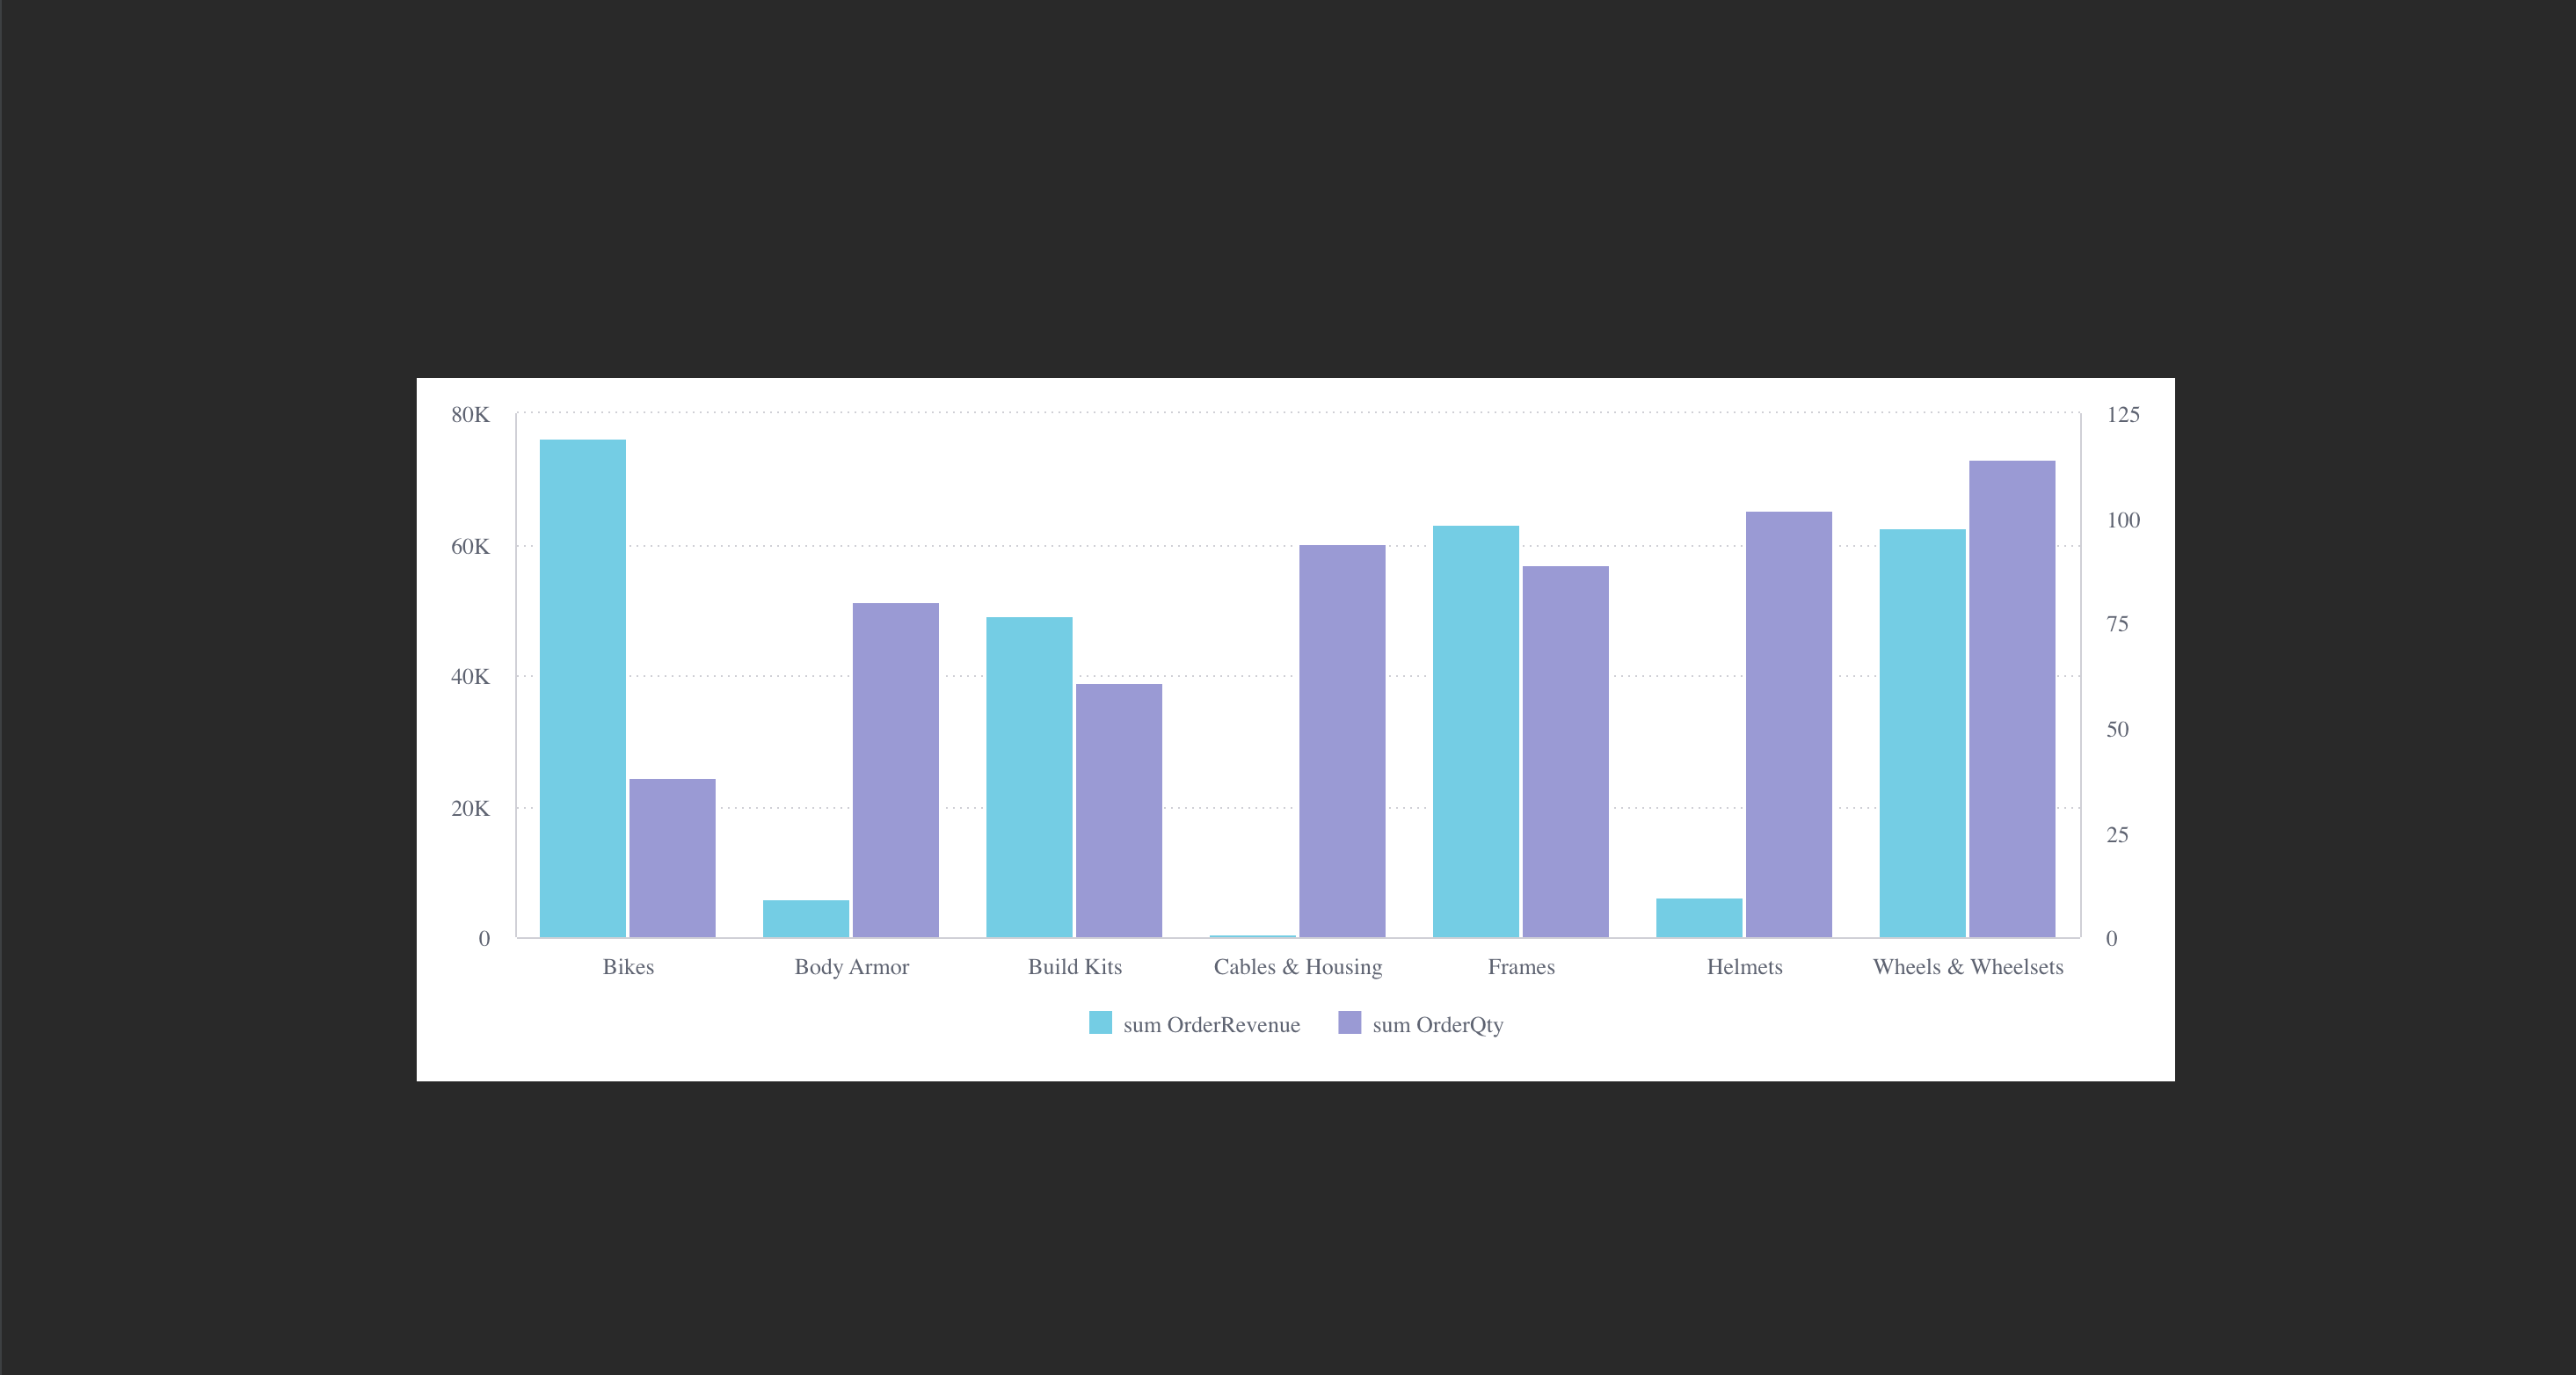
This should be the result:

# Add NLG
Let's supplement this chart with some insights using Sisense's natural language generation (NLG) API. We'll add the GetNlgInsights component underneath the chart we just made.
<Chart
  // ...
/>
<GetNlgInsights
  dataSource={DM.DataSource}
  dimensions={dimensions}
  measures={measures}
>
The props into the GetNlgInsights component are pretty similar to what is passed into the ExecuteQuery component. The difference is that we're getting text in natural language instead of tabular data as a result.
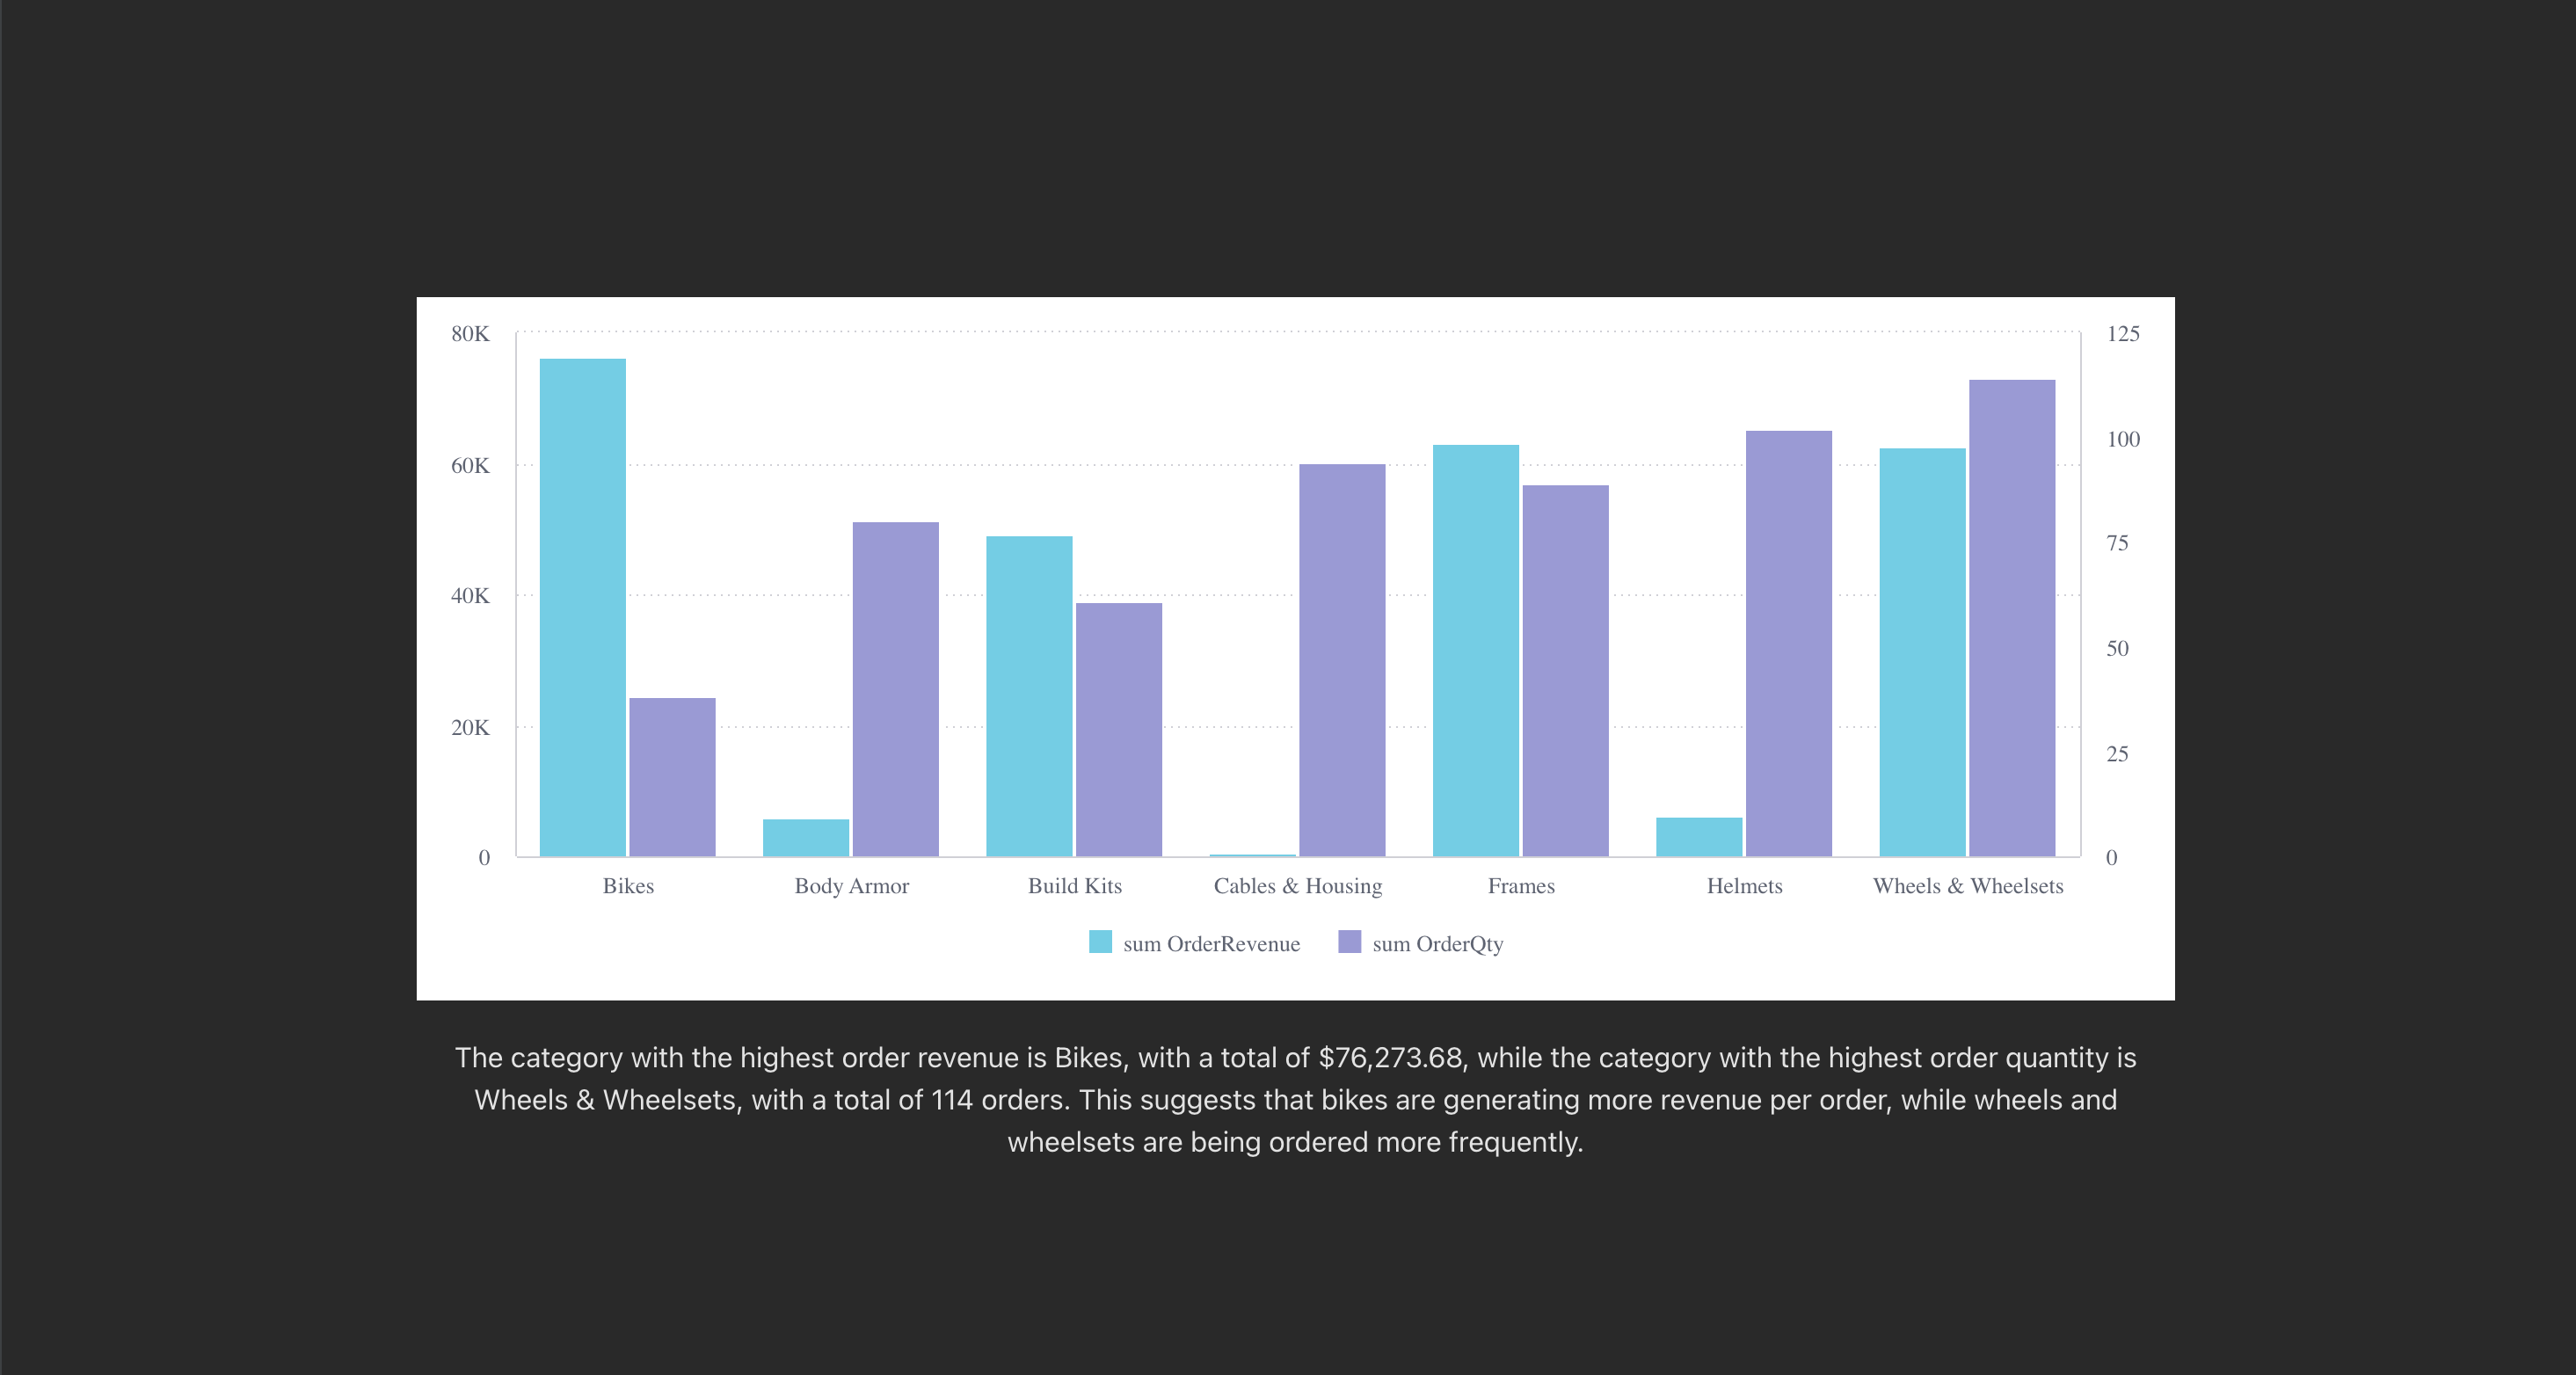
Depending on how your LLM is configured, the text output might be a little different, but it should look something like this:

# Format NLG output
We want to highlight key text from the NLG output, like any numbers or quantities that might appear. To do this, it might be easier to switch to the useGetNlgInsights hook, which will just give us a plain string without the container.
Let's go ahead and add the hook right after where we define our dimensions and measures variables.
const dimensions = [DM.DimProducts.CategoryName];
const measures = [
  measureFactory.sum(DM.Fact_Sale_orders.OrderRevenue),
  measureFactory.sum(DM.Fact_Sale_orders.OrderQty),
];
const { data } = useGetNlgInsights({
  dataSource: DM.DataSource,
  dimensions,
  measures,
})
The useGetNlgInsights hook expects the exact same props as the GetNlgInsights component.
Let's format the data and then render it right underneath our GetNlgInsights hook.
const { data } = useGetNlgInsights({
  dataSource: DM.DataSource,
  dimensions,
  measures,
})

let summaryMarkup;
if (data) {
  summaryMarkup = {
    __html: data.replace(/(\d+)/g, "<b>$1</b>"),
  };
}

return (
  <div /* ... */>
    <Chart
      // ...
    />
    <GetNlgInsights
      // ...
    />
    {summaryMarkup && <div dangerouslySetInnerHTML={summaryMarkup} />}
  </div>
)
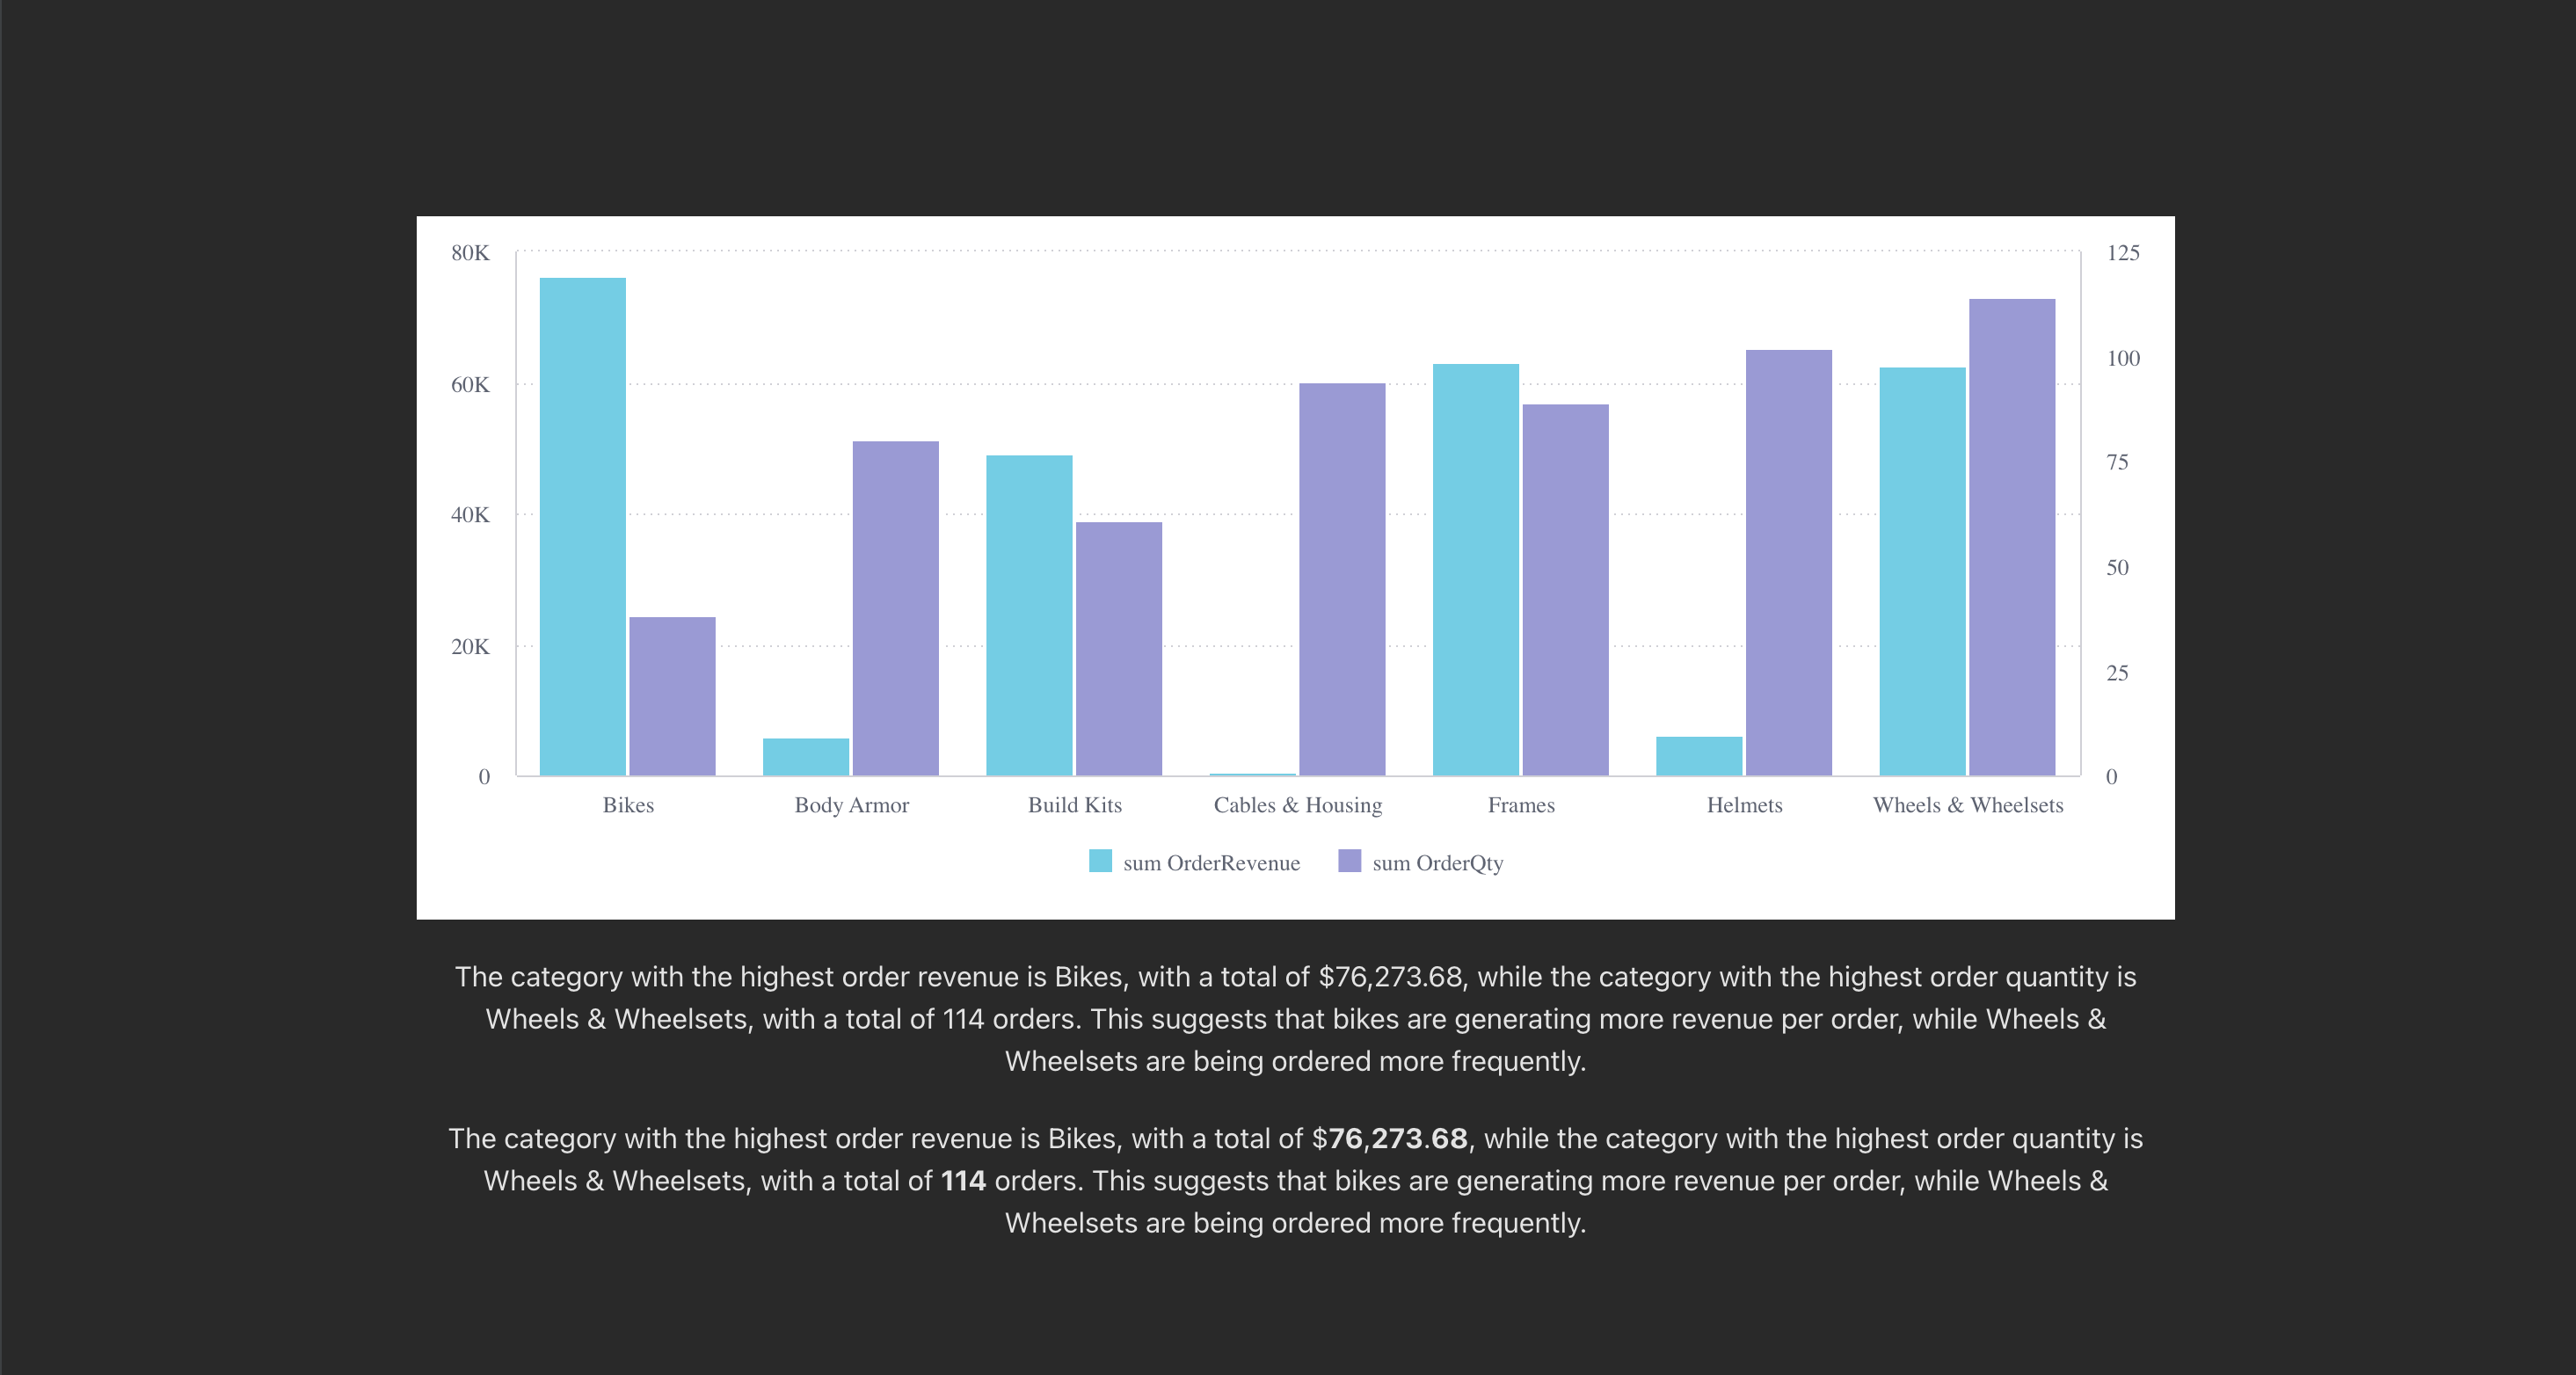
It's not the cleanest code, but we've effectively made all digits in the text summary bold, so here's the expected result:

# Code sample
Here's the complete App.tsx file with all the code we've written in this lesson.
import { Chart } from "@sisense/sdk-ui";
import { GetNlgInsights, useGetNlgInsights } from "@sisense/sdk-ui/ai";
import { measureFactory } from "@sisense/sdk-data";
import * as DM from "./models/sample-retail";

function App() {
  const dimensions = [DM.DimProducts.CategoryName];
  const measures = [
    measureFactory.sum(DM.Fact_Sale_orders.OrderRevenue),
    measureFactory.sum(DM.Fact_Sale_orders.OrderQty),
  ];
  const { data } = useGetNlgInsights({
    dataSource: DM.DataSource,
    dimensions,
    measures,
  });

  let summaryMarkup;
  if (data) {
    summaryMarkup = {
      __html: data.replace(/(\d+)/g, "<b>$1</b>"),
    };
  }

  return (
    <div
      style={{
        display: "flex",
        flexDirection: "column",
        rowGap: 20,
        width: 1000,
      }}
    >
      <Chart
        dataSet={DM.DataSource}
        chartType={"column"}
        dataOptions={{
          category: dimensions,
          value: [
            measures[0],
            {
              column: measures[1],
              showOnRightAxis: true,
            },
          ],
        }}
        styleOptions={{
          height: 400,
        }}
      />
      <GetNlgInsights
        dataSource={DM.DataSource}
        dimensions={dimensions}
        measures={measures}
      />
      {summaryMarkup && <div dangerouslySetInnerHTML={summaryMarkup} />}
    </div>
  );
}

export default App;