# Lesson 1 | Setup
In this lesson you’ll learn how to set up a new Compose SDK project and display your first chart in that project.
# Prerequisites
Before getting started, you’ll need:
- Node.js version 16 or higher
- npm
You’ll also need access to a Sisense instance with:
- The Sample Retail data source (you may need to go into the Sample Retail data model and unhide some of the columns that are hidden by default)
- An API Token you can use to query with
- CORS settings that allow requests from
http://localhost:5173, the URL that Vite serves your project on locally
# Project Code
You can follow along with this tutorial, writing the code as you go, to build the project on your own. You can also find the code for the tutorial project in a GitHub repo (opens new window).
The tutorial repo is structured with a number of branches, each branch contains the code as it should be at a number of natural stopping points along the way of building the project. We’ll point out the stopping points when we reach them. The main branch of the repository contains the code for the finished project.
To work with the code from the repository:
- Fork the repo
- Run
npm installto install all dependencies - Rename the
env.local.examplefile toenv.local - In the
env.localfile, enter the URL and API Token you’ll use to connect to your Sisense instance - Run
npm start
From here on, we’ll assume that you’re writing the code on your own. But always know that you can use the code from the project if you get stuck, to skip ahead, or if you’re just too lazy to write the code yourself. Don’t worry, we won’t tell anybody.
# Create a project
Let’s start by creating a React project and installing dependencies. We’ll use Vite to create a new project.
- Navigate to the directory where you want to create your project
- Run
npm create vite@latest - Name your project
compose-sdk-charts-tutorialwhen prompted - Select
Reactas the framework - Select
TypeScriptas the variant - Run
cd compose-sdk-charts-tutorialto navigate to your project directory - Run
npm installto install your project and dependencies - Run
npm i @sisense/sdk-ui @sisense/sdk-datato install Sisense packages
# Generate data model
Next we’ll generate a TypeScript representation of the Sample Retail data model. We’ll use this in our code when we need to refer to the data model in the Sisense instance.
You can generate a data model TypeScript file using the Compose SDK CLI tool.
To generate the data model:
- Create a folder in the
srcdirectory of you project namedmodels - Run the following command
npx @sisense/sdk-cli@latest get-data-model --token <api-token> --output src/models/sample-retail.ts --dataSource "Sample Retail" --url <your-instance-url>
Be sure to replace the placeholders with your API token and the URL of your Sisense instance.
# Add a context provider
Now we can start writing our first bit of code.
Since most of our Compose SDK functionality needs access to a Sisense instance, the first thing we need to do is set up that access with <SisenseContextProvider>. There are a number of places you can choose to add it. Here, we’ll add the provider in main.tsx.
In main.tsx, import the SisenseContextProvider from the sdk-ui module:
import { SisenseContextProvider } from '@sisense/sdk-ui';
Wrap the <App> component with a <SisenseContextProvider> like this:
<SisenseContextProvider
  url={import.meta.env.VITE_APP_SISENSE_URL}
  token={import.meta.env.VITE_APP_SISENSE_TOKEN}
>
  <App />
</SisenseContextProvider>
This will read the Sisense instance URL and API Token from an .env, so let’s add that file now.
- Create a file named
.env.localin your project’s root directory - Add a
VITE_APP_SISENSE_URLvariable and set its value to your Sisense instance’s URL - Add a
VITE_APP_SISENSE_TOKENvariable and set it value to your API Token
Your .env.local file should look something like this:
VITE_APP_SISENSE_URL="http://myinstanceurl/"
VITE_APP_SISENSE_TOKEN="OiJhbGJeyciIUzI1..."
# Add a chart
Finally, with all the setup out of the way we can add our first chart to our project.
In the App.tsx file, import the <Chart> component, the measureFactory namespace, and the TypeScript representation of the Sample Retail data model that we created earlier.
Note: From here on in we won’t mention imports anymore. Just know that you’ll need to add the appropriate imports as we continue to add code to our project.
import { Chart } from '@sisense/sdk-ui';
import { measureFactory } from '@sisense/sdk-data';
import * as DM from './models/sample-retail';
Then, replace the contents of the App() function with the following code to create a chart.
return (
  <Chart
    dataSet={DM.DataSource}
    chartType={'column'}
    dataOptions={{
        category: [DM.DimProducts.CategoryName],
        value: [measureFactory.sum(DM.Fact_Sale_orders.OrderRevenue)],
    }}
    styleOptions={{
        width: 1000,
        height: 400,
    }}
  />
);
This is our first chart, so let’s take a minute to understand what this code does.
First we add a chart component to our app.
<Chart
//...
/>
Inside the chart component we set the chart’s data set as the data source of the Sample Retail data model we imported.
dataSet={DM.DataSource}
We also set the chart’s type to be a column chart.
chartType={'column'}
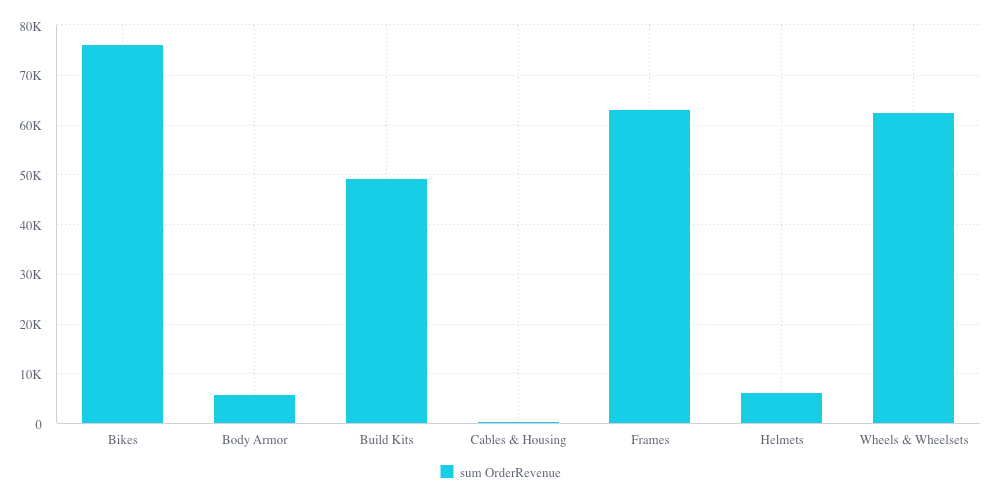
Then, we set the data options. For this chart we’re getting the sum of sales order revenue categorized by product categories.
dataOptions={{
  category: [DM.DimProducts.CategoryName],
  value: [measureFactory.sum(DM.Fact_Sale_orders.OrderRevenue)],
}}
Notice how we’re using the imported data model again. This lets us conveniently refer to the attributes in our data model. Here we also use a measure function to perform an aggregation on one of our attributes to create a value for our chart.
And finally, we set some basic style options to define the size of the chart.
styleOptions={{
  width: 1000,
  height: 400,
}}
# Run
Use the npm run dev command to get your project up and running so you can see it in action.
Navigate to http://localhost:5173 in a browser to see your first chart. It should look like this:

TIP
The code up until this point can be found in branch 1-setup (opens new window).
# Up next
Great job creating your first chart. In the next lesson you’ll learn about different ways to show data in a chart. Go to Lesson 2.