# Tutorial
In this tutorial, we’ll walk you through the steps of creating your first project with Compose SDK. We’ll work with charts and learn several ways to customize them. After completing this tutorial, you’ll have the fundamental skills necessary to start your own Compose SDK projects.
# What you'll learn
Along the way, you’ll learn how to:
- Setup a new project to work with Compose SDK
- Work with chart data from a Sisense instance
- Filter and highlight the chart data
- Use callbacks to customize the look and behavior of your charts
- Dynamically change the contents and layout a chart
# What you'll build
While developing our project, we’ll focus on functionality and try to minimize any code that will distract from that goal. So, while what we build might not look too pretty, it will be packed with features that you can apply to lots of different situations.
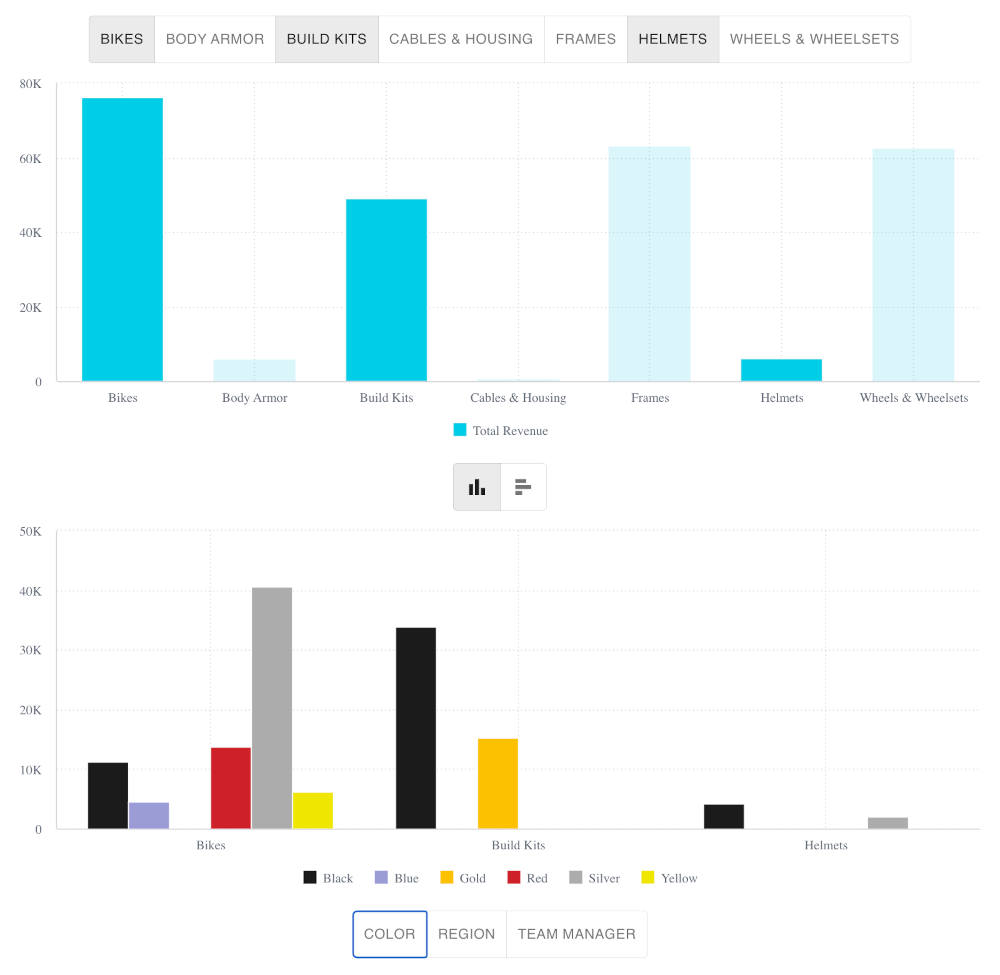
When done, we’ll have built a page that includes two charts. The charts use the Sample Retail data model from a Sisense instance. The top chart shows sales revenue per product category. The bottom chart also shows sales revenue per product category, but broken down by either product color, country region, or team manager.
We’ll build the first chart so that you can highlight certain data using toggle buttons or by clicking on data in the chart. Highlighting data in the top chart changes which data is displayed in the bottom chart.
We’ll also add the option to change the chart type from a column chart to bar chart.

# Get started
Let's get started by setting up a Compose SDK project. Go to Lesson 1.