# Interface StyledColumn
Wrapped Column with styles controlling how the column is visualized in a chart.
# Example
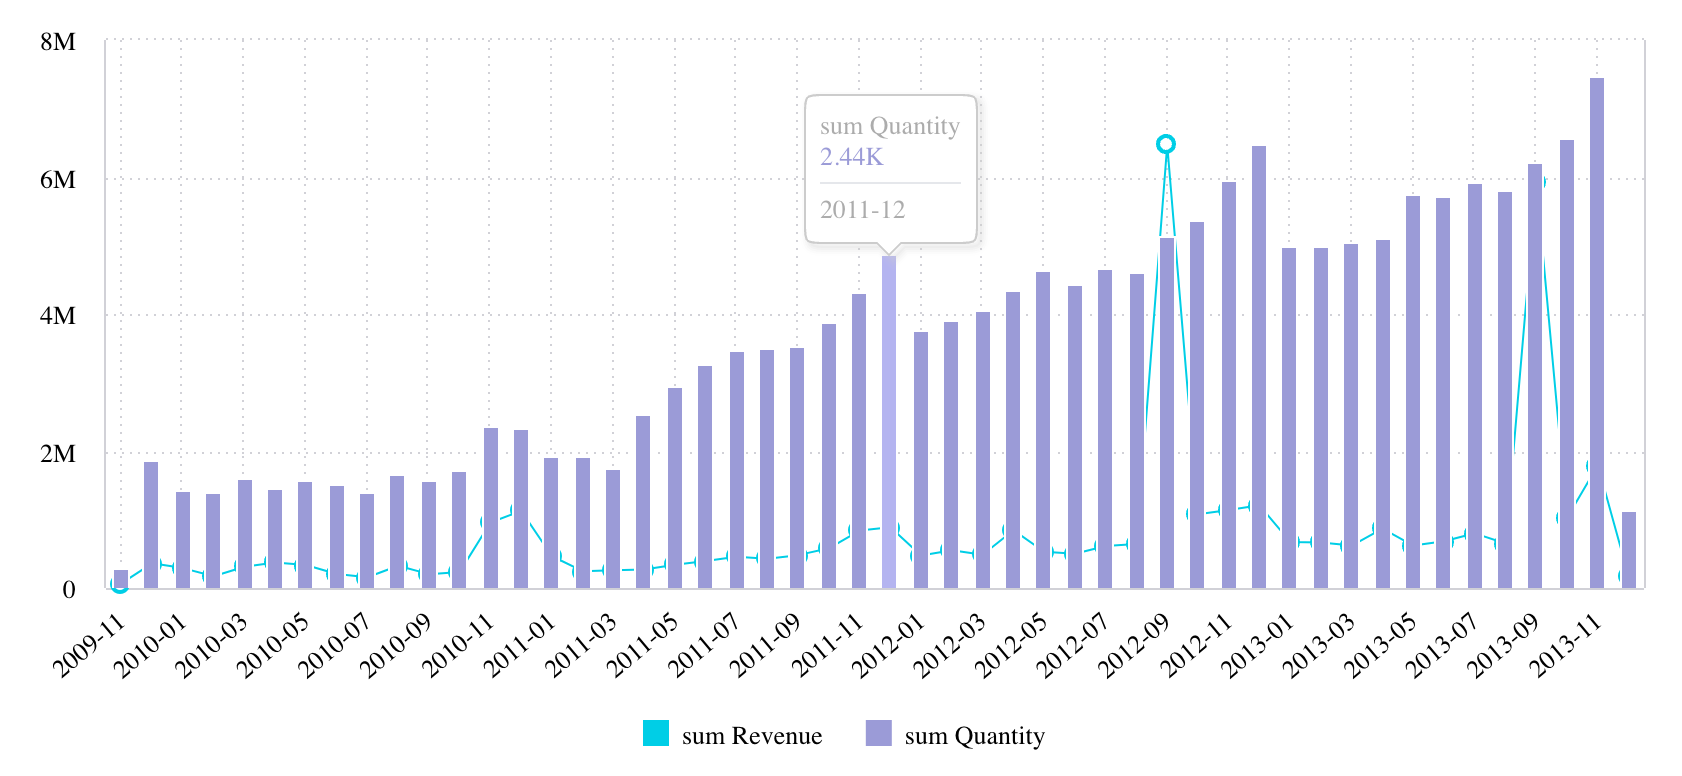
An example of using StyledColumn to change the date format of the months displayed on the x-axis.
<Chart
  dataSet={DM.DataSource}
  chartType={'line'}
  dataOptions={{
    category: [
      {
        column: DM.Commerce.Date.Months,
        dateFormat: 'yy-MM',
      },
    ],
    value: [
      measureFactory.sum(DM.Commerce.Revenue),
      {
        column: measureFactory.sum(DM.Commerce.Quantity),
        showOnRightAxis: true,
        chartType: 'column',
      },
    ],
    breakBy: [],
  }}
/>
Also, see StyledMeasureColumn.
# Properties
# color
color?:
DataColorOptions
All possible color options for data.
# column
column:
Column
Wrapped Column
# continuous
continuous?:
boolean
Boolean flag to toggle continuous timeline on this date column.
# dateFormat
dateFormat?:
string
Date format.
See ECMAScript Date Time String Format (opens new window)
Note that 'YYYY' and 'DD' have been disabled since they often get confused with 'yyyy' and 'dd' and can produce unexpected results.
# geoLevel
geoLevel?:
ScattermapLocationLevel
Geographic location level for Scattermap chart.
# granularity
granularity?:
string
Date granularity that works with continuous timeline.
Values from DateLevels.
# includeSubTotals
includeSubTotals?:
boolean
Boolean flag whether to include subtotals for this dimension in the pivot table.
# isColored
isColored?:
boolean
# isHtml
isHtml?:
boolean
Boolean flag whether to render category/column value as HTML in the Table component.
# numberFormatConfig
numberFormatConfig?:
NumberFormatConfig
Configuration for number formatting.
# sortType
sortType?:
PivotRowsSort|SortDirection
Sorting configuration that represents either SortDirection or PivotRowsSort for the pivot table