# Class Chart
A Vue component used for easily switching chart types or rendering multiple series of different chart types.
# Example
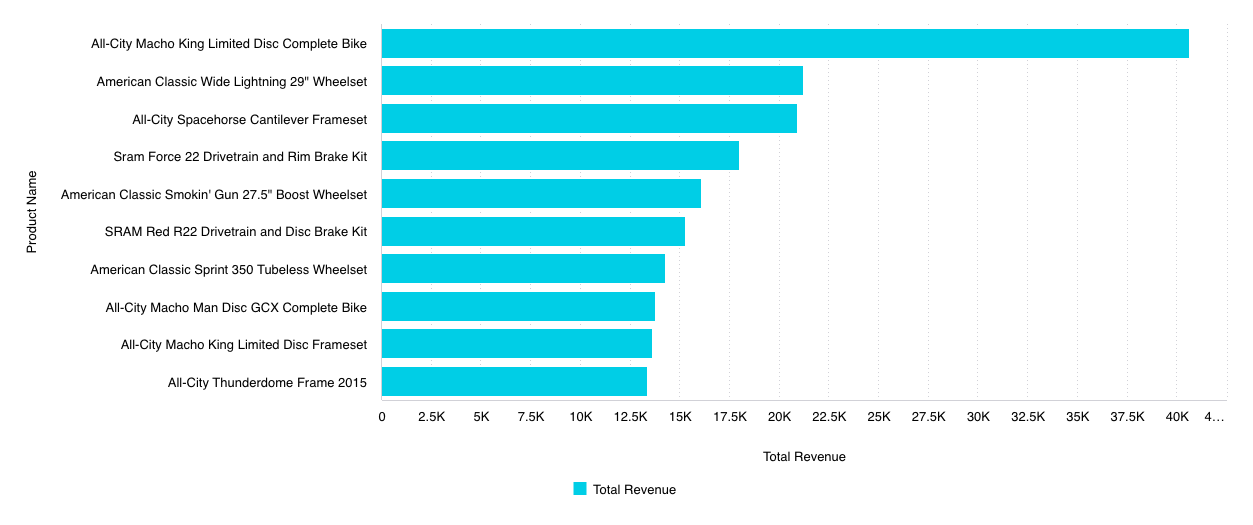
An example of using the Chart component to
plot a bar chart of the Sample Retail data source hosted in a Sisense instance:
<script setup lang="ts">
import { Chart } from '@sisense/sdk-ui-vue';
import type { ChartProps } from '@sisense/sdk-ui-vue';
import * as DM from '../assets/sample-retail-model';
import { measureFactory, filterFactory } from '@sisense/sdk-data';
import { ref } from 'vue';

const dimProductName = DM.DimProducts.ProductName;
const measureTotalRevenue = measureFactory.sum(DM.Fact_Sale_orders.OrderRevenue, 'Total Revenue');

const chartProps = ref<ChartProps>({
 chartType: 'bar',
 dataSet: DM.DataSource,
 dataOptions: {
   category: [dimProductName],
   value: [{ column: measureTotalRevenue, sortType: 'sortDesc' }],
   breakBy: [],
 },
 filters: [filterFactory.topRanking(dimProductName, measureTotalRevenue, 10)],
 styleOptions: {
   xAxis: {
     title: {
       text: 'Product Name',
       enabled: true,
     },
   },
   yAxis: {
     title: {
       text: 'Total Revenue',
       enabled: true,
     },
   },
 },
});
</script>

<template>
    <Chart
      :chartType="chartProps.chartType"
      :dataSet="chartProps.dataSet"
      :dataOptions="chartProps.dataOptions"
      :filters="chartProps.filters"
      :styleOptions="chartProps.styleOptions"
    />
</template>
# Param
Chart properties
# Properties
# Data
# dataSet
readonlydataSet?:Data|DataSource
Data set for a chart using one of the following options. If neither option is specified, the chart
will use the defaultDataSource specified in the parent SisenseContextProvider
component.
(1) Sisense data source name as a string. For example, 'Sample ECommerce'. Typically, you
retrieve the data source name from a data model you create using the get-data-model command (opens new window) of the Compose SDK CLI. Under the hood, the chart
connects to the data source, executes a query, and loads the data as specified in
dataOptions, filters, and highlights.
To learn more about using data from a Sisense data source, see the Compose SDK Charts Guide.
OR
(2) Explicit Data, which is made up of an array of
Column objects and a two-dimensional array of row data. This approach
allows the chart component to be used with any data you provide.
To learn more about using data from an external data source, see the Compose SDK Charts Guide.
Example data in the proper format:
const sampleData = {
  columns: [
    { name: 'Years', type: 'date' },
    { name: 'Quantity', type: 'number' },
    { name: 'Units', type: 'number' },
  ],
  rows: [
    ['2019', 5500, 1500],
    ['2020', 4471, 7000],
    ['2021', 1812, 5000],
    ['2022', 5001, 6000],
    ['2023', 2045, 4000],
  ],
};
# filters
readonlyfilters?:FilterRelations|Filter[]
Filters to limit (or slice) a chart’s data using one of the following options.
(1) Array of Filter or FilterRelations returned from filter factory functions, such as
greaterThan() and members().
Use this option for filters that do not require a UI to set them or for filters where you will supply your own UI components or use pre-built UI components. This is the most common option.
To learn more about using filter factory functions to create filters, see the Compose SDK Charts Guide.
(2) Array of Filter controlled by filter UI components – for example MemberFilterTile.
Use this option for filters that you want your users to set using pre-built UI components.
To learn more about using filter UI components to create filters, see the Compose SDK Charts Guide.
# highlights
readonlyhighlights?:Filter[]
Highlights based on filter criteria to apply to a chart using one of the following options.
NOTE that the filter dimensions used in highlights must match those defined in the
dataOptions of the chart. Otherwise, the filters will be applied as regular slice filters.
(1) Array of Filter returned from filter factory functions, such as
greaterThan() and members().
Use this option for highlights that do not require a UI to set them or for highlights where you will supply your own UI components or use pre-built UI components. This is the most common option.
To learn more about using filter factory functions to create highlights, see the Compose SDK Charts Guide.
(2) Array of Filter controlled by filter UI components – for example MemberFilterTile.
Use this option for highlights that you want your users to set using pre-built UI components.
To learn more about using filter components to create highlights, see the Compose SDK Charts Guide.
# Chart
# chartType
readonlychartType:ChartType
Default chart type of each series.
# dataOptions
readonlydataOptions:ChartDataOptions
Configurations for how to interpret and present a chart's data.
To learn more about using data options, see the Compose SDK Charts Guide.
# styleOptions
readonlystyleOptions?:ChartStyleOptions
Configurations for how to style and present a chart's data.
To learn more about using style options, see the Compose SDK Charts Guide.
# Callbacks
# onBeforeRender
readonlyonBeforeRender?:BeforeRenderHandler|IndicatorBeforeRenderHandler
A callback that allows you to customize the underlying chart element before it is rendered. The returned options are then used when rendering the chart.
This callback is not supported for Areamap Chart, Scattermap Chart, Table, and PivotTable.
# onDataPointClick
readonlyonDataPointClick?:AreamapDataPointEventHandler|BoxplotDataPointEventHandler|DataPointEventHandler|IndicatorDataPointEventHandler|ScatterDataPointEventHandler|ScattermapDataPointEventHandler
Click handler callback for a data point
# onDataPointContextMenu
readonlyonDataPointContextMenu?:BoxplotDataPointEventHandler|DataPointEventHandler|ScatterDataPointEventHandler
Context menu handler callback for a data point
# onDataPointsSelected
readonlyonDataPointsSelected?:DataPointsEventHandler|ScatterDataPointsEventHandler
Handler callback for selection of multiple data points
# onDataReady
readonlyonDataReady?: (data) =>Data
A callback that allows to modify data immediately after it has been retrieved. Can be used to inject modification of queried data.
# Parameters
| Parameter | Type |
|---|---|
data | Data |