# Drilldown
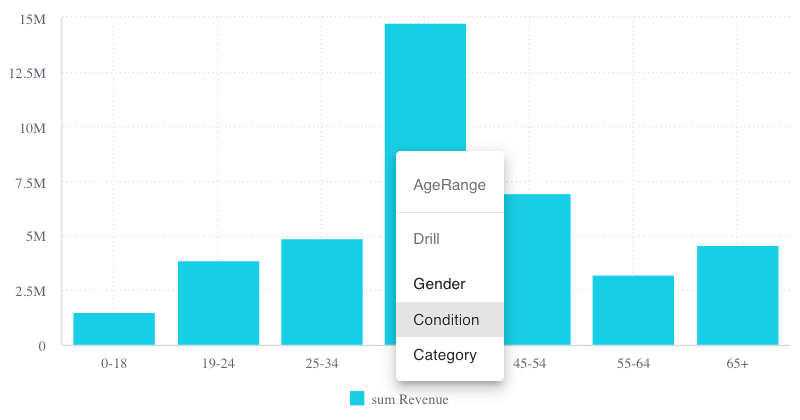
Drilling down on a chart allows your users to see more detailed data by selecting a dimension to drill down on. This enables them to examine complex datasets in a more manageable and intuitive way.
With Compose SDK you can create a drilldown experience using the charts in the sdk-ui-* modules:

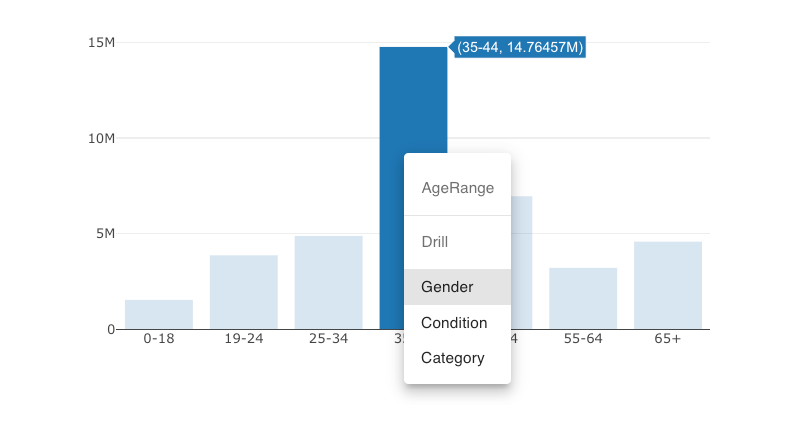
You can also create a drilldown experience using third party charts:

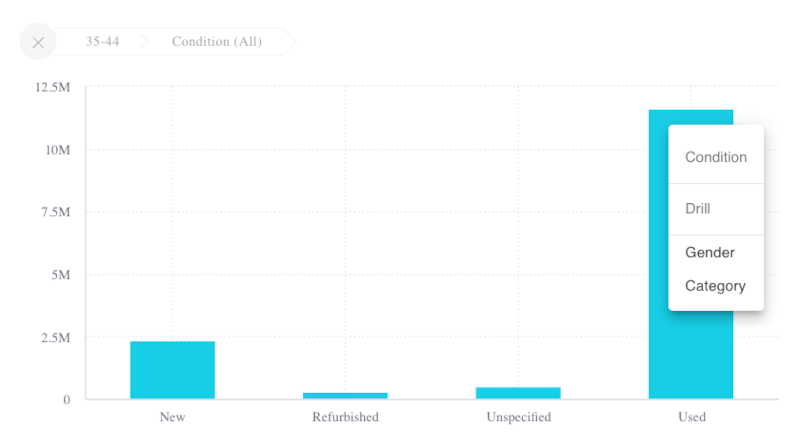
With both types of charts, you can use the built in drilldown-related components to show drilldown context menus and drilldown breadcrumbs:

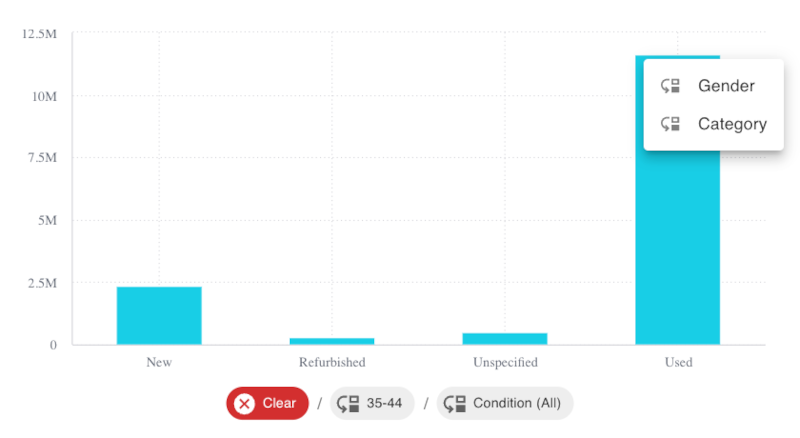
Or you can provide your own custom context menu and breadcrumbs components:

If you're new to drilldown charts, start by learning how to create a simple drilldown chart.