# Compose SDK with Angular: Quickstart Guide
Follow this guide to get started developing applications with Compose SDK.
Note: This guide is for
Angular. We also have a Quickstart Guide for
React and
Vue.
# Prerequisites
Compose SDK contains a set of components needed to interface with your Sisense instance. The following prerequisites are needed in order to use the SDK:
- Familiarity with front-end web development (opens new window), including Node.js, JavaScript/TypeScript, and Angular.
- Node.js (opens new window) version 16.0.0 or higher.
- Angular (opens new window) version 17 or higher.
- A Node package manager such as npm (opens new window) or Yarn (opens new window).
- Access to a Sisense (opens new window) instance with a queryable data source (for example, Sample Healthcare).
- Angular application with TypeScript. You can use an existing application, or if you don't have one, you can follow the tutorial (opens new window) to create one.
Package manager: In Angular
npmis the default choice and this guide will also adoptnpm.You can opt to switch to
Yarnby following the instructions in a blog post (opens new window) from Angular University.
# Quickstart Application Setup
For this quickstart guide we'll create a new Angular project using comand line tool (opens new window).
If you're using an existing project, skip to Installing the SDK packages.
- Create or navigate to the directory in which you want to create your Angular app.
- Run this command to create your new Angular app.
npm init @angular compose-sdk-app
- When prompted, choose to add Angular routing, then press Enter to accept the default option.
This creates a new Angular app in the
compose-sdk-appdirectory. - Run this command to navigate to the newly created directory.
cd compose-sdk-app
- Install the dependencies.
npm install
- To run the application, use:
npm start
# Installing the SDK Packages
Compose SDK for Angular contains three packages for public use:
- @sisense/sdk-ui-angular (opens new window): Angular components and services for rendering charts and executing queries against a Sisense instance.
- @sisense/sdk-data (opens new window): Implementations of dimensional modeling elements including dimensions, attributes, measures, and filters.
- @sisense/sdk-cli (opens new window): A command-line tool for generating a TypeScript representation of a Sisense data model.
The Compose SDK packages are deployed via public NPM Registry. To install @sisense/sdk-ui-angular and @sisense/sdk-data for your app:
npm i @sisense/sdk-ui-angular @sisense/sdk-data
Package @sisense/sdk-cli is not needed to run your app. It will be installed on the fly as you execute CLI commands using npx (opens new window).
# Sisense Authentication and Security
In order to retrieve data, you need to authenticate your application with your Sisense instance and set up CORS.
# Authentication
There are a number of different ways you can authenticate your application. To learn more, see Authentication and Security.
Here, we'll use an API Token that we retrieve using the Compose SDK tool. To do so, run the get-api-token command:
npx @sisense/sdk-cli@latest get-api-token --url <your_instance_url> --username <username>
Hold on to the API Token. You'll need it later when adding Compose SDK code to your application.
# CORS Settings
There are also a number of different ways you can set up CORS. To learn more, see Authentication and Security.
Here we'll use the Sisense UI. To do so, in your Sisense instance, go to Admin > Security & Access > Security Settings > General and add your application's domain to the CORS Allowed Origins list.
# Adding Sisense to Your Application
This section describes how to add Compose SDK to your application to render charts from data in your Sisense instance.
# Generating a Data Model Representation
To visualize data in your application using Compose SDK, first make sure you have a data model in your Sisense instance. Then, create a TypeScript representation of it in your project. This is done using the CLI command which automatically generates it, or you can create it manually using the same syntax.
Once you have a TypeScript representation of your data model, you define measures, dimensions and filters and easily create sophisticated queries. There is no need to specify complex JOINS relationships or GROUP BYS that you do when using SQL and other query languages because the Sisense semantic query engine will do that for you.
Run the following command to create a sample-healthcare.ts file in directory src/ of the application. The file contains a TypeScript representation of the Sample Healthcare data model.
npx @sisense/sdk-cli@latest get-data-model --username "<username>" --output src/sample-healthcare.ts --dataSource "Sample Healthcare" --url <your_instance_url>
Enter your password to complete the command and generate the data model representation.
Note: You can use other authentication methods such as WAT (
--wat "<your_token>"), or API token (--token "<your_API_token>") when generating the data model representation.
The resulting file, which is created in the src/ directory, should look something like below:
import type { Dimension, DateDimension, Attribute } from '@sisense/sdk-data';
import { createAttribute, createDateDimension, createDimension } from '@sisense/sdk-data';

export const DataSource = 'Sample Healthcare';

interface AdmissionsDimension extends Dimension {
  Cost_of_admission: Attribute;
  Death: Attribute;
  Diagnosis_ID: Attribute;
  Doctor_ID: Attribute;
  HAI: Attribute;
  ID: Attribute;
  Patient_ID: Attribute;
  Room_ID: Attribute;
  SSI: Attribute;
  Surgical_Procedure: Attribute;
  TimeofStay: Attribute;
  Admission_Time: DateDimension;
  Discharge_Time: DateDimension;
}
export const Admissions = createDimension({
  name: 'Admissions',
  Cost_of_admission: createAttribute({
    name: 'Cost_of_admission',
    type: 'numeric-attribute',
    expression: '[Admissions.Cost_of_admission]',
  }),
...
This works for any data model, including models you create. Just replace "Sample Healthcare" with the name of your data model.
# Embedding a Chart in your Application
In this section, you will add a new component and modify the main app module to embed a chart visualizing data from the Sample Healthcare data source.
Note: The following assumptions are made about your application:
- The
sample-healthcare.tsfile generated earlier resides insrc/.- The URL to your application (f.e. http://localhost:4200) is already added as an entry to CORS Allowed Origins section on your Sisense instance
# Connecting to a Sisense Instance
Add a Sisense provider that contains all relevant information about the Sisense instance and ensures it is available to all Compose SDK components. The authentication method used to access your Sisense instance is defined in this provider.
The following examples shows how to add a provider to src/app/app.config.ts.
import { ApplicationConfig, provideZoneChangeDetection } from '@angular/core';
import { provideRouter } from '@angular/router';
import { SISENSE_CONTEXT_CONFIG_TOKEN, SisenseContextConfig } from '@sisense/sdk-ui-angular';

import { routes } from './app.routes';

export const SISENSE_CONTEXT_CONFIG: SisenseContextConfig = {
    url: '<instance url>', // replace with the URL of your Sisense instance
    token: '<api token>', // replace with the API token of your user account
};

export const appConfig: ApplicationConfig = {
  providers: [
    { provide: SISENSE_CONTEXT_CONFIG_TOKEN, useValue: SISENSE_CONTEXT_CONFIG },
    provideZoneChangeDetection({ eventCoalescing: true }),
    provideRouter(routes)]
};
Note: The above example uses the API token (also called bearer authentication) to connect to a Sisense instance. To generate an API token for your Sisense user account, see the Sisense Instance Authentication section above. The provider also supports other authentication mechanisms including WAT and SSO.
# Adding a component and routing
To render a chart in your application that queries your data model, you need to create a new component that uses the data utilities along with your previously generated data model file.
Here, we'll add a new Analytics component with the help of the ng CLI tool. You can do it manually. For more information, see the guide (opens new window) from Angular.
Run following in your terminal from the project directory:
npx ng generate component analytics
This should result in a new folder with three files inside:
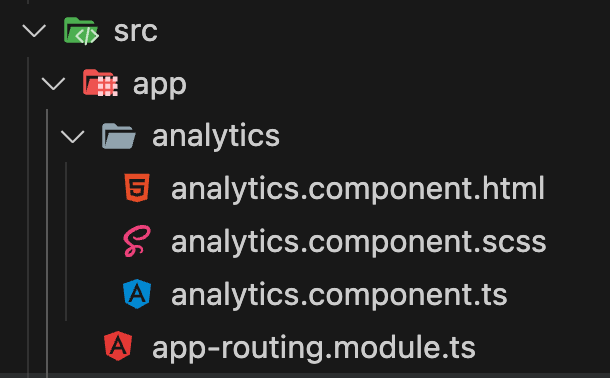
Next, configure the routing and point the main page to the Analytics component.
The app.routes.ts file should look like this now:
import { AnalyticsComponent } from './analytics/analytics.component';
import { Routes } from '@angular/router';

export const routes: Routes = [
    {path: '', component: AnalyticsComponent}
];
Replace the contents of the app.component.html file with:
<router-outlet></router-outlet>
# Adding a chart
Use the dataOptions property (ChartProps interface) to assign table columns or attributes from your data model to the categories and values of a chart. This is similar to the Data panel in the Sisense Widget Editor, where you can drag and drop columns to the Categories, Values, and Break By fields. For example, if you wanted to render a line chart with Doctors' Specialty on the X-axis and an average aggregation of Time of Stay on the Y-axis, your dataOptions object would look like:
// chartType={'line'}
{
  category: [DM.Doctors.Specialty],
  value: [measureFactory.average(DM.Admissions.TimeofStay)],
  breakBy: [],
}
Note: Use
measureFactory.average()from the example above to specify theaveragetype aggregation on theTimeofStaycategory. ThismeasureFactoryutility is exported from the@sisense/sdk-datalibrary and supports other aggregation types. See themeasureFactorydocumentation for more information.
The following is a complete example of a rendered chart in an application.
// src/app/analytics/analytics.component.ts

import { Component } from '@angular/core';
import { measureFactory } from '@sisense/sdk-data';
import * as DM from '../../sample-healthcare';
import { SdkUiModule } from '@sisense/sdk-ui-angular';

@Component({
  selector: 'app-analytics',
  standalone: true,
  imports: [SdkUiModule],
  templateUrl: './analytics.component.html',
  styleUrl: './analytics.component.scss'
})
export class AnalyticsComponent {
  chart = {
    chartType: 'line' as const,
    dataSet: DM.DataSource,
    dataOptions: {
      category: [DM.Doctors.Specialty],
      value: [measureFactory.average(DM.Admissions.TimeofStay, 'Average time of stay')],
      breakBy: [],
    },
    styleOptions: {
      legend: {
        enabled: true,
        position: 'bottom',
      },
    },
  };

  logArguments(...args: any[]) {
    console.log(args);
  }
}
// src/app/analytics/analytics.component.html

<h3 [align]="'center'">My Sisense Compose SDK Chart</h3>
<csdk-chart
    [chartType]="chart.chartType"
    [dataSet]="chart.dataSet"
    [dataOptions]="chart.dataOptions"
    [styleOptions]="chart.styleOptions"
    (dataPointClick)="logArguments($event)"
  />
At this point, check your application in the browser if it's already running or run npm start to run your application and view it in a browser.
Your first Compose SDK chart with Angular should look something like this:
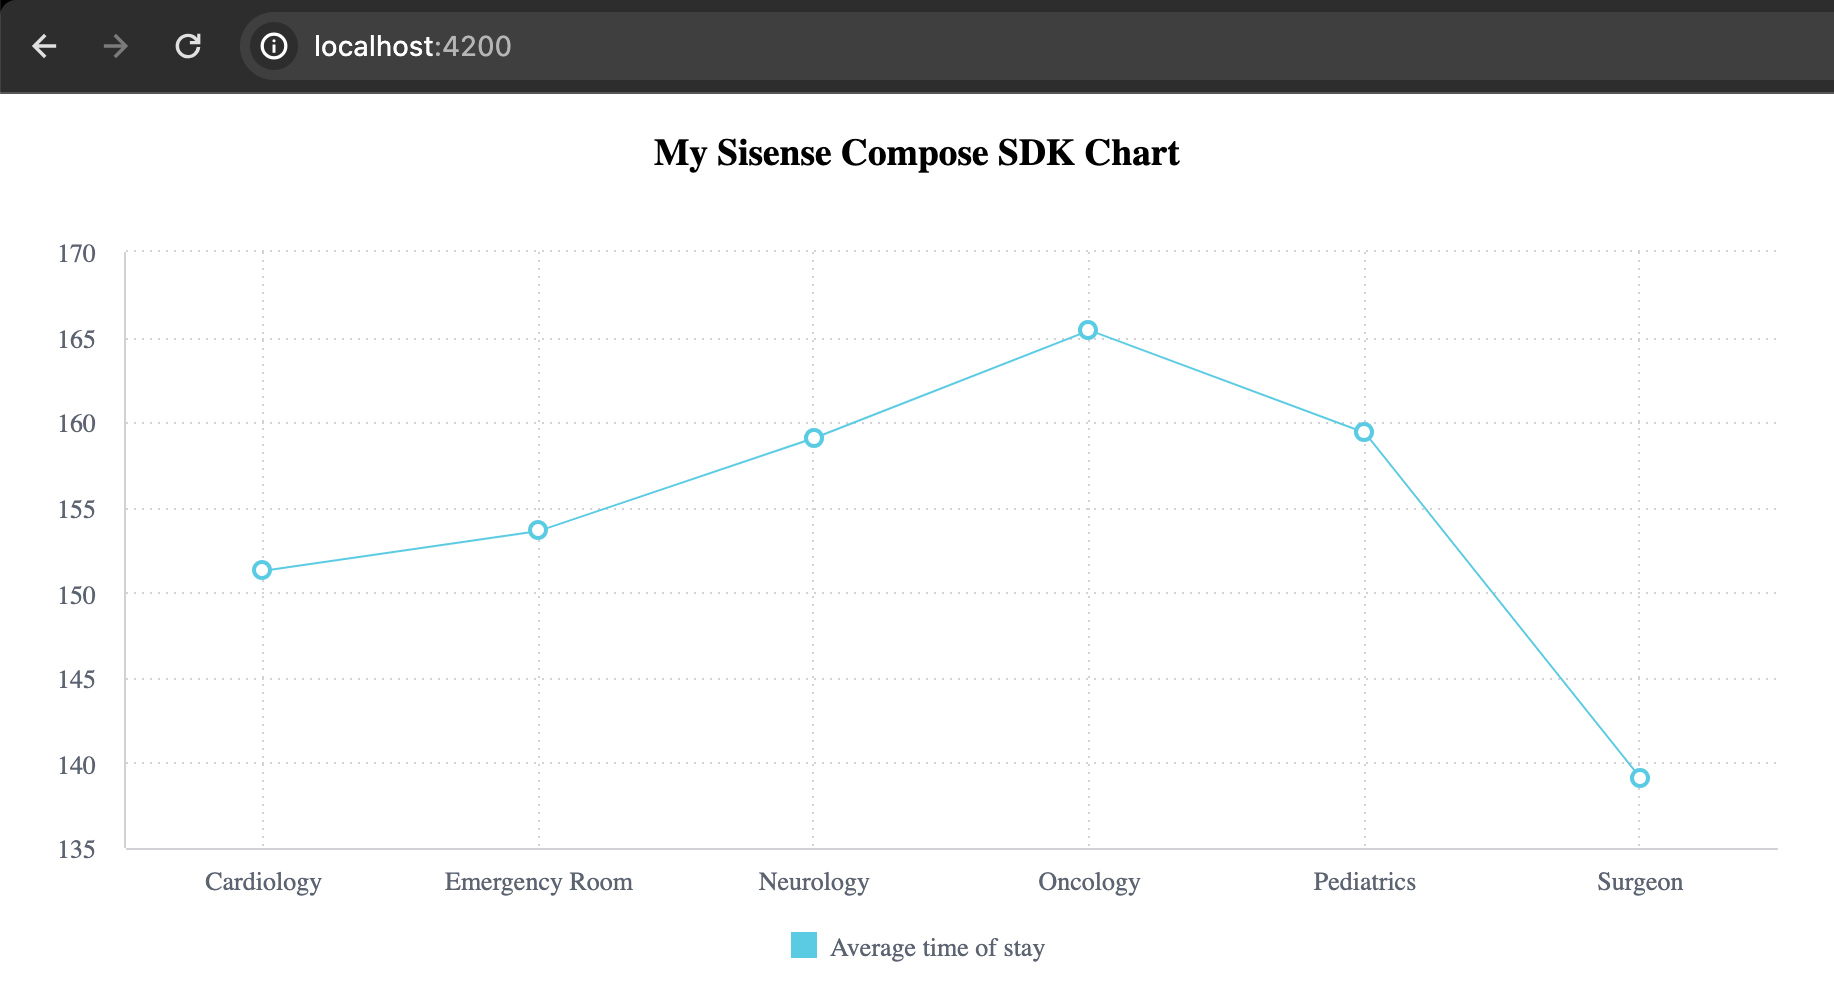
See the SISENSE_CONTEXT_CONFIG_TOKEN and ChartComponent docs for more details on supported props.
# Next Steps
The sample application in this quickstart guide is designed to give you a basis for what you can do with Compose SDK. Build on the code sample by using other components from Compose SDK to add Sisense analytical experiences to your applications.
Check out our demo application for Compose SDK with Angular (opens new window).