# Interface StyledMeasureColumn
Wrapped Measure Column with styles controlling how the measure is visualized in a chart.
# Example
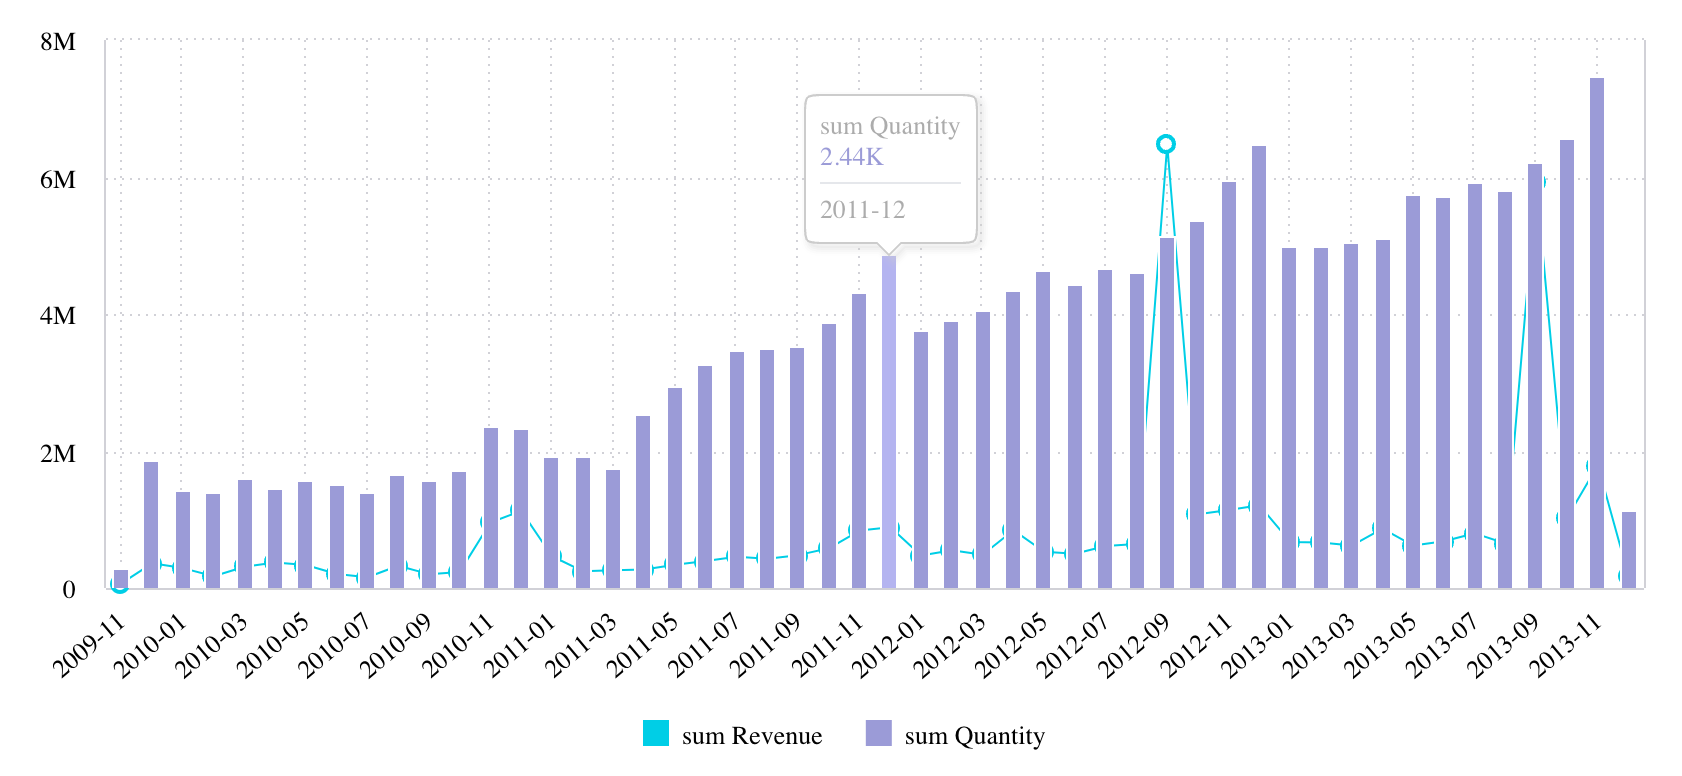
Example of using StyledMeasureColumn to mix a column series of Total Revenue to a line chart.
Note that the chart doesn't display a second Y-axis on the right but that can be customized by style options.
<Chart
  dataSet={DM.DataSource}
  chartType={'line'}
  dataOptions={{
    category: [
      {
        column: DM.Commerce.Date.Months,
        dateFormat: 'yy-MM',
      },
    ],
    value: [
      measureFactory.sum(DM.Commerce.Revenue),
      {
        column: measureFactory.sum(DM.Commerce.Quantity),
        showOnRightAxis: true,
        chartType: 'column',
      },
    ],
    breakBy: [],
  }}
/>
See also StyledColumn.
# Properties
# chartType
chartType?:
SeriesChartType
Series chart type, which is used with StyledMeasureColumn to customize series in a mixed chart.
# color
color?:
DataColorOptions
All possible color options for data.
# column
column:
MeasureColumn|CalculatedMeasureColumn
Wrapped MeasureColumn or CalculatedMeasureColumn
# connectNulls
connectNulls?:
boolean
Boolean flag whether to connect a graph line across null points or render a gap
# dataBars
dataBars?:
boolean
Boolean flag whether to display data bars for this measure in the pivot table.
# numberFormatConfig
numberFormatConfig?:
NumberFormatConfig
Configuration for number formatting.
# seriesStyleOptions
seriesStyleOptions?:
SeriesStyleOptions
Specific style options to be applied to specific series in Chart. Supported only for cartesian and polar charts.
# showOnRightAxis
showOnRightAxis?:
boolean
Boolean flag whether to show this value/measure
on the right axis (true) or on the left axis (false).
# sortType
sortType?:
SortDirection
Sorting direction, either in Ascending order, Descending order, or None
# totalsCalculation
totalsCalculation?:
TotalsCalculation
Calculation for the totals of this measure in the pivot table.
# treatNullDataAsZeros
treatNullDataAsZeros?:
boolean
Boolean flag whether null values are treated as zeros in the chart