✅ You are viewing documentation for the latest version of Compose SDK.
Version:
# Function IndicatorChart
IndicatorChart(
props):ReactElement<any,any> |null
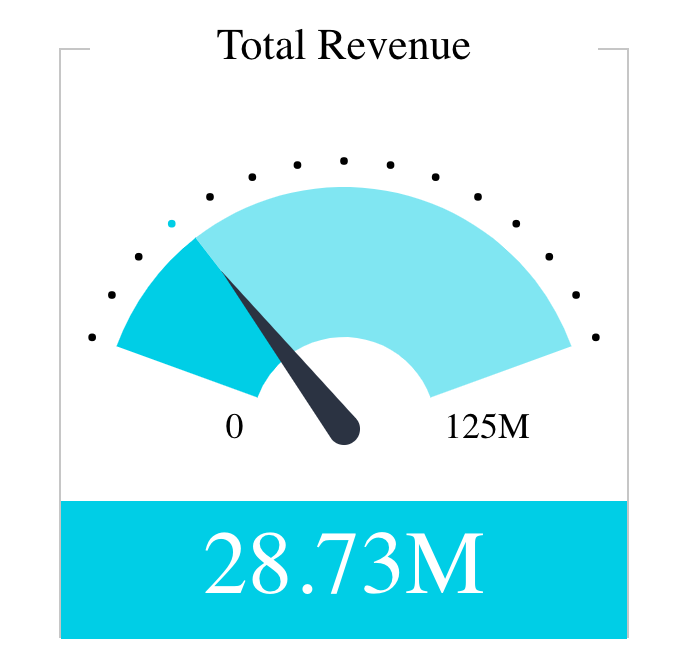
A React component that provides various options for displaying one or two numeric values as a number, gauge or ticker.
# Parameters
| Parameter | Type | Description |
|---|---|---|
props | IndicatorChartProps | Indicator chart properties |
# Returns
ReactElement< any, any > | null
Indicator Chart component
# Example
An example of using the component to visualize the Sample ECommerce data source:
<IndicatorChart
  dataSet={DM.DataSource}
  dataOptions={{
    value: [
      {
        column: measureFactory.sum(DM.Commerce.Revenue),
        numberFormatConfig: {
          name: 'Numbers',
          decimalScale: 2,
          trillion: true,
          billion: true,
          million: true,
          kilo: true,
          thousandSeparator: true,
          prefix: false,
          symbol: '$',
        },
      },
    ],
    secondary: [],
    min: [measureFactory.constant(0)],
    max: [measureFactory.constant(125000000)],
  }}
  filters={[filterFactory.greaterThan(DM.Commerce.Revenue, 1000)]}
  styleOptions={{
    indicatorComponents: {
      title: {
        shouldBeShown: true,
        text: 'Total Revenue',
      },
      secondaryTitle: {
        text: '',
      },
      ticks: {
        shouldBeShown: true,
      },
      labels: {
        shouldBeShown: true,
      },
    },
    subtype: 'indicator/gauge',
    skin: 1,
  }}
/>
