✅ You are viewing documentation for the latest version of Compose SDK.
Version:
# Function AreaRangeChart
AreaRangeChart(
props):ReactElement<any,any> |null
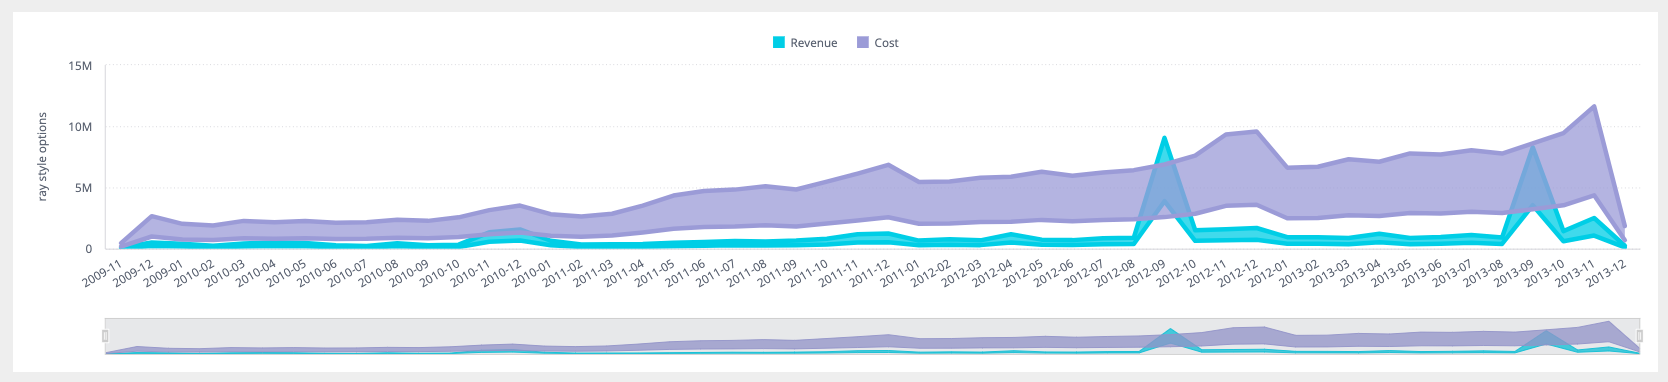
A React component that displays a range of data over a given time period or across multiple categories. It is particularly useful for visualizing the minimum and maximum values in a dataset, along with the area between these values.
# Parameters
| Parameter | Type | Description |
|---|---|---|
props | AreaRangeChartProps | Area Range chart properties |
# Returns
ReactElement< any, any > | null
Area Range Chart component
# Example
An example of using the component to visualize the Sample ECommerce data source:
    <AreaRangeChart
      dataSet={DM.DataSource}
      dataOptions={{
        category: [DM.Commerce.Date.Months],
        value: [
          {
            title: 'Revenue',
            upperBound: measureFactory.multiply(
              measureFactory.sum(DM.Commerce.Revenue, 'Lower Revenue'),
              0.6,
            ),
            lowerBound: measureFactory.multiply(
              measureFactory.sum(DM.Commerce.Revenue, 'Upper Revenue'),
              1.4,
            ),
          },
          {
            title: 'Cost',
            upperBound: measureFactory.multiply(
              measureFactory.sum(DM.Commerce.Cost, 'Lower Cost'),
              0.9,
            ),
            lowerBound: measureFactory.multiply(
              measureFactory.sum(DM.Commerce.Cost, 'Upper Cost'),
              2.4,
            ),
          },
        ],
        breakBy: [],
      }}
      styleOptions={{
        legend: {
          enabled: true,
          position: 'top',
        },
        lineWidth: {
          width: 'thick',
        },
        yAxis: {
          title: {
            enabled: true,
            text: 'ray style options',
          },
          enabled: true,
          gridLines: true,
          logarithmic: false,
        },
      }}
    />