# Number & Date Formatting
This guide demonstrates how to customize the formatting of numbers and dates in your Compose SDK charts.
# Number Formatting
You can format numbers in your chart using the numberFormatConfig property of StyledColumn or StyledMeasureColumn objects.
There are 3 main ways to format numbers. Specify the type of formatting using the name property with one of the following values:
'Numbers': Format as regular numbers that are not currency or percentages'Currency': Format as currency'Percent': Format as a percentage
For each of these format types, you can customize the formatting using the following properties:
thousandsSeparator(boolean): Whether to show a thousands separator. Defaults totrue.decimalScale(number): Number of decimal places to show.
Depending on which type of formatting you use, you can also customize the formatting using the properties described below.
# Numbers
Use the following properties to customize the formatting of regular numbers:
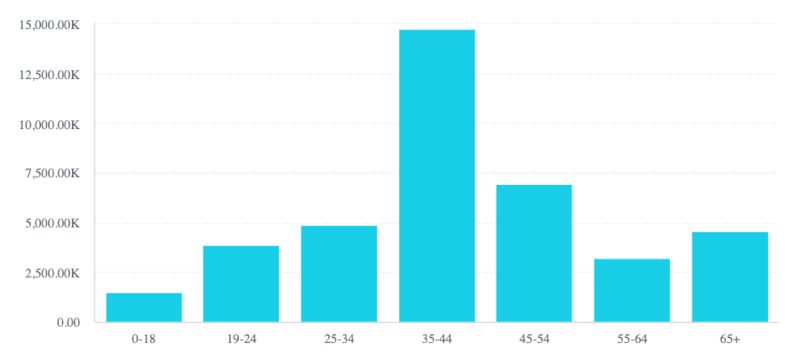
trillion(boolean): Whether to abbreviate numbers greater than or equal one trillion. Defaults totrue.billion(boolean): Whether to abbreviate numbers greater than or equal one billion. Defaults totrue.million(boolean): Whether to abbreviate numbers greater than or equal one million. Defaults totrue.kilo(boolean): Whether to abbreviate numbers greater than or equal one thousand. Defaults totrue.
# Numbers Example

<Chart
  chartType={'column'}
  dataSet={DM.DataSource}
  dataOptions={{
    category: [DM.Commerce.AgeRange],
    value: [
      {
        column: measureFactory.sum(DM.Commerce.Revenue),
        numberFormatConfig: {
          name: 'Numbers',
          million: false,
          decimalScale: 2,
        },
      },
    ],
  }}
/>
# Currency
Use the following properties to customize the formatting of numbers representing currency:
prefix(boolean): Whether to show thesymbolbefore the number (true) or after the number (false). Defaults totrue.symbol(string): Symbol to show before or after the number, depending on theprefixvalue. Defaults to'$'.trillion(boolean): Whether to abbreviate numbers greater than or equal one trillion. Defaults totrue.billion(boolean): Whether to abbreviate numbers greater than or equal one billion. Defaults totrue.million(boolean): Whether to abbreviate numbers greater than or equal one million. Defaults totrue.kilo(boolean): Whether to abbreviate numbers greater than or equal one thousand. Defaults totrue.
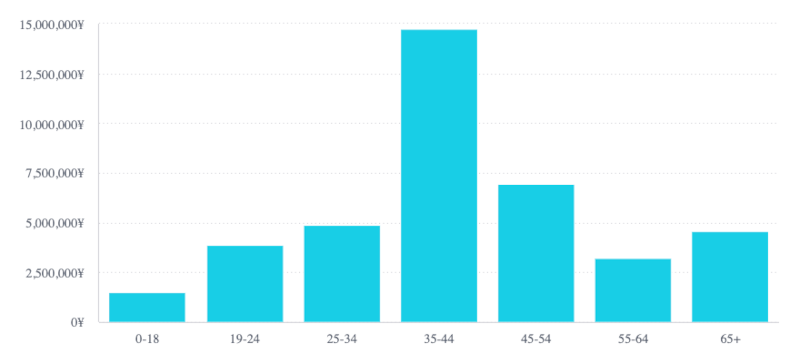
# Currency Example

<Chart
  chartType={'column'}
  dataSet={DM.DataSource}
  dataOptions={{
    category: [DM.Commerce.AgeRange],
    value: [
      {
        column: measureFactory.sum(DM.Commerce.Revenue),
        numberFormatConfig: {
          name: 'Currency',
          million: false,
          kilo: false,
          prefix: false,
          symbol: '¥',
        },
      },
    ],
  }}
/>
# Percent
The percent type doesn't have any additional properties for further customization.
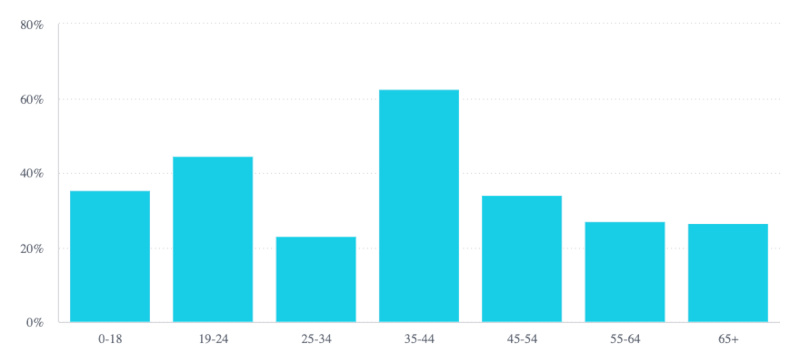
# Percent Example

<Chart
  chartType={'column'}
  dataSet={DM.DataSource}
  dataOptions={{
    category: [DM.Commerce.AgeRange],
    value: [
      {
        column: measureFactory.divide(
          measureFactory.sum(DM.Commerce.Revenue),
          measureFactory.sum(DM.Commerce.Cost)
        ),
        numberFormatConfig: {
          name: 'Percent',
        },
      },
    ],
  }}
/>
# Date Formatting
You can format dates in your chart categories using the dateFormat property of a StyledColumn or StyledMeasureColumn object. Provide the function with a format string using a ECMAScript Date Time String Format (opens new window) string.
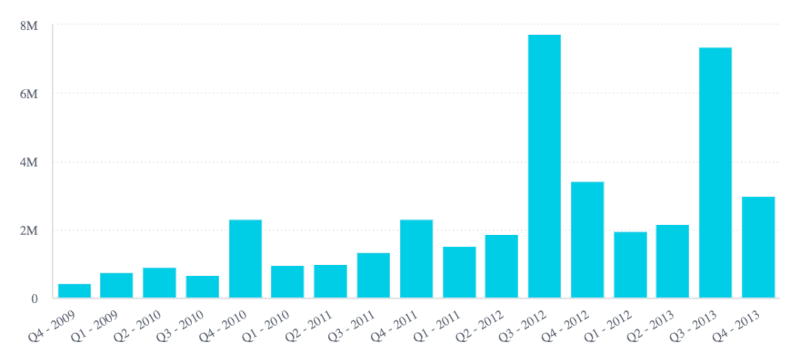
# Date Example

<Chart
  chartType={'column'}
  dataSet={DM.DataSource}
  dataOptions={{
    category: [{column: DM.Commerce.Date.Quarters, dateFormat: 'qqq - yyyy'}],
    value: [
      {
        column: measureFactory.sum(DM.Commerce.Revenue),
      },
    ],
  }}
/>